Cruise tourism’s $3.6 billion contribution to national economy
NewsAn independent report commissioned by Cruise Lines International Association (CLIA) Australasia has revealed that cruise tourism contributed $3.6 billion to the national economy in 2014-2015. That is an 11.6 percent increase since 2013, when the contribution was $3.2 billion.
The rise in cruise equity has been credited to many factors. For example, the homeported ships saw a 10.3 percent rise in passenger capacity and 8.8 percent increase on visiting ships. Besides, passenger spends also grew to $814 million which is a 12.5 per cent increase.
The massive growth has also led to increase in infrastructure costs of cruise lines. For example Carnival Australia has seen a 15 percent increase in ship supplies and maintenance, 12 percent increase in food and beverage and 17 percent more on shore excursions.
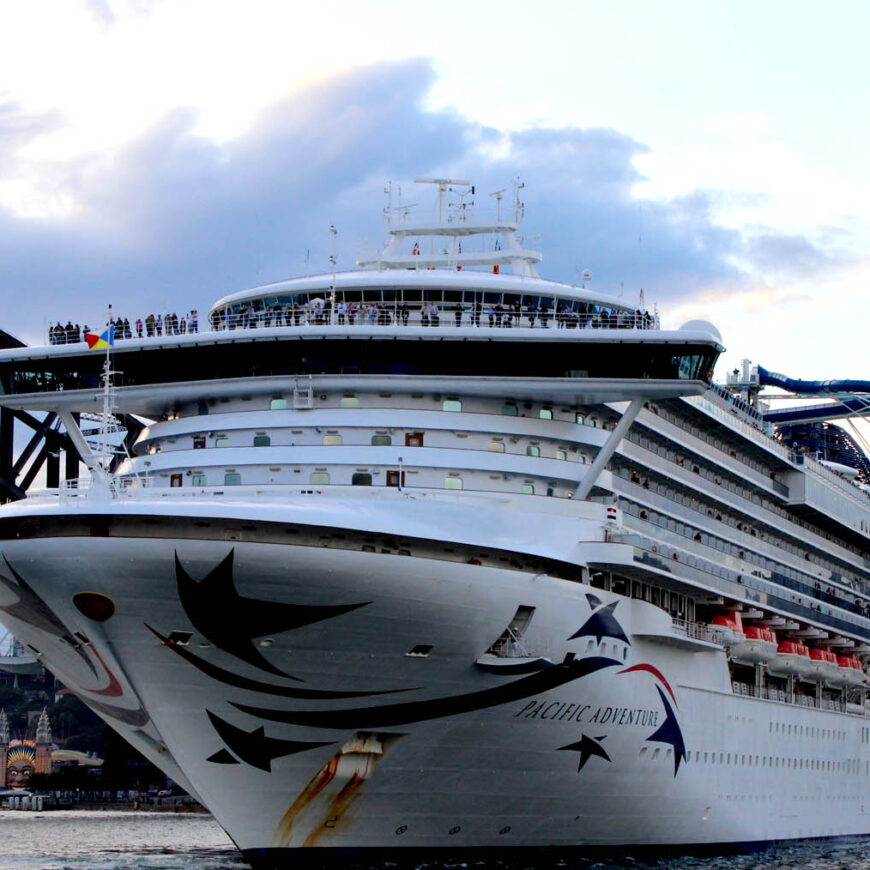
Commenting on the report Carnival Australia Executive Chairman, Ms Ann Sherry said, “Carnival Australia cruise brands have contributed significantly to the increase in the number of ships home ported in Australia, which has helped drive the big increase in purchasing from local suppliers especially in the food and beverage area.”
“The expansion of the home brand P&O Cruises’ fleet, with the addition of Pacific Aria and Pacific Eden, has played a big part in this and also in the increase in the number of regional destinations now regularly hosting cruise ship visits.”
CLIA Australasia Managing Director Neil Linwood said it provided a valuable insight into the industry’s growth and future.
“This report not only captures the impressive growth of the cruise industry, it also records the shifting structure of the industry as capacity constraints start to bite,” Mr Linwood said.
Key Highlights of ‘Contribution of Cruise Tourism to the Australian Economy’ 2014-2015 report
1. Cruising generated $3.6 billion in economic value in the 2014-15 financial year – up 11.6 per cent on the 2013 figure of $3.2 billion
2. Cruise line expenditure rose 11 per cent to $1.069 billion in 2014-15. This included a 20 per cent rise in travel agent commissions to $145 million
3. Passenger expenditure rose 12.5 per cent to $814 million
4. Cruising accounted for 15,217 jobs in 2014-15
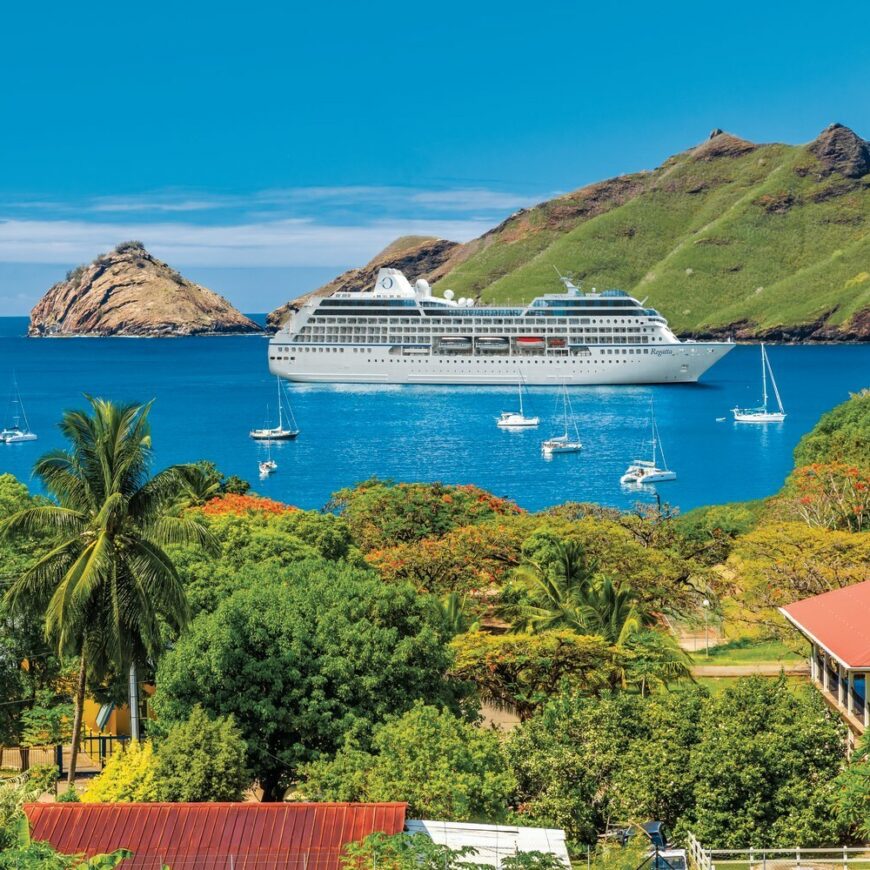
5. Passenger/crew visits days rose 8.8 per cent (up 11.5 per cent for passengers visiting Australian ports on homeported ships and 4.1 per cent for passengers visiting on transiting ships)
6. Overall cruise ship visit days increase only 1.7 per cent but average ship capacity rose 10.3 per cent for homeported ships and 8.8 per cent for transit ships
7. Homeported ship calls rose 8.3 per cent while transit port calls fell 4.3 per cent
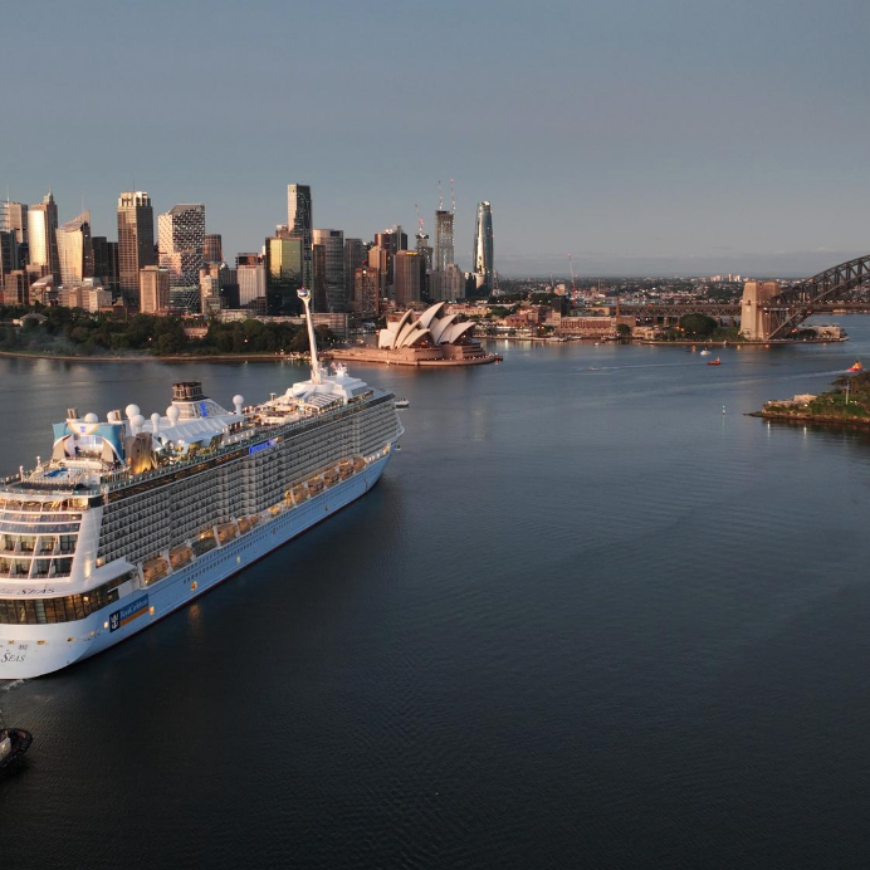
8. NSW remained the dominant state accounting for 68 per cent of the overall economic contribution
9. Across Australia, homeported passengers spent an average of just over $505 per visit day while transit passengers spent an average of $160 per visit day